Anomaly management
From AI-powered detection to structured satellite investigations.
Overview
Role: Product Designer @Intella
Product: AI-powered satellite operations platform
Focus: Event highlights, investigation management, workflow automation
Satellite operations generate vast amounts of telemetry that operators must continuously monitor to identify unusual behaviours and understand potential anomalies.
Working on Mercury at Intella, I led the design of features that help operators move from raw signals to structured investigations. The goal was to reduce the need for manual exploration, make relevant events easier to identify and provide a clear way to manage investigations across operational shifts.

The challenge
Detecting an anomaly is only the beginning.
Identifying unusual satellite behaviour is just one part of the process. Operators also need to understand what happened, assess its relevance, investigate potential causes and determine what to do next.
When this process starts with manually navigating telemetry and piecing together correlations, it becomes difficult to maintain a clear overview of priorities and ongoing investigations.
The challenge was to move beyond anomaly detection and support the entire process that follows it, helping operators understand where to focus their attention and maintain continuity as investigations progress across shifts.
Rethinking anomaly investigation
From highlighting signals to highlighting what matters.
The initial approach was to highlight anomalies directly on telemetry charts, making unusual behaviours easier to spot.
However, as we explored the problem further, we realized that this approach overlapped with existing threshold-based alerts. It made individual signals more visible, but did little to help operators understand what deserved attention or how to move forward with an investigation.
We decided to take a step further.
Instead of making telemetry the centre of the experience, we shifted the focus towards the anomaly itself. By surfacing relevant events, suggested correlations and contextual information, we could bring the investigation to a more advanced stage before operators even started exploring the underlying data.
Telemetry remained essential, but its role changed: from the starting point of the investigation to an additional source of evidence that helps operators understand and validate an anomaly.


The key design decision was to move from highlighting data points to highlighting actionable events.
Instead of asking operators to discover every anomaly by exploring charts and correlating signals themselves, Mercury surfaces relevant events and provides context to support the investigation.
This shifts the starting point from raw telemetry to a more structured overview of anomalies that deserve attention. Suggested correlations help operators understand the relationships between signals, while the event itself becomes the entry point for further analysis.
The objective was not to replace telemetry analysis, but to make it more focused by giving operators a clearer idea of what to investigate and why.
Design focus
Surface relevant events instead of relying exclusively on chart-level highlights.
Provide contextual information and suggested correlations.
Make it easier to identify where further investigation is needed.
From manual discovery to structured investigation.
An anomaly investigation does not necessarily end within a single shift. Without a shared way to track progress, it can be difficult to understand what has already been investigated, what remains unresolved and why a decision was made.
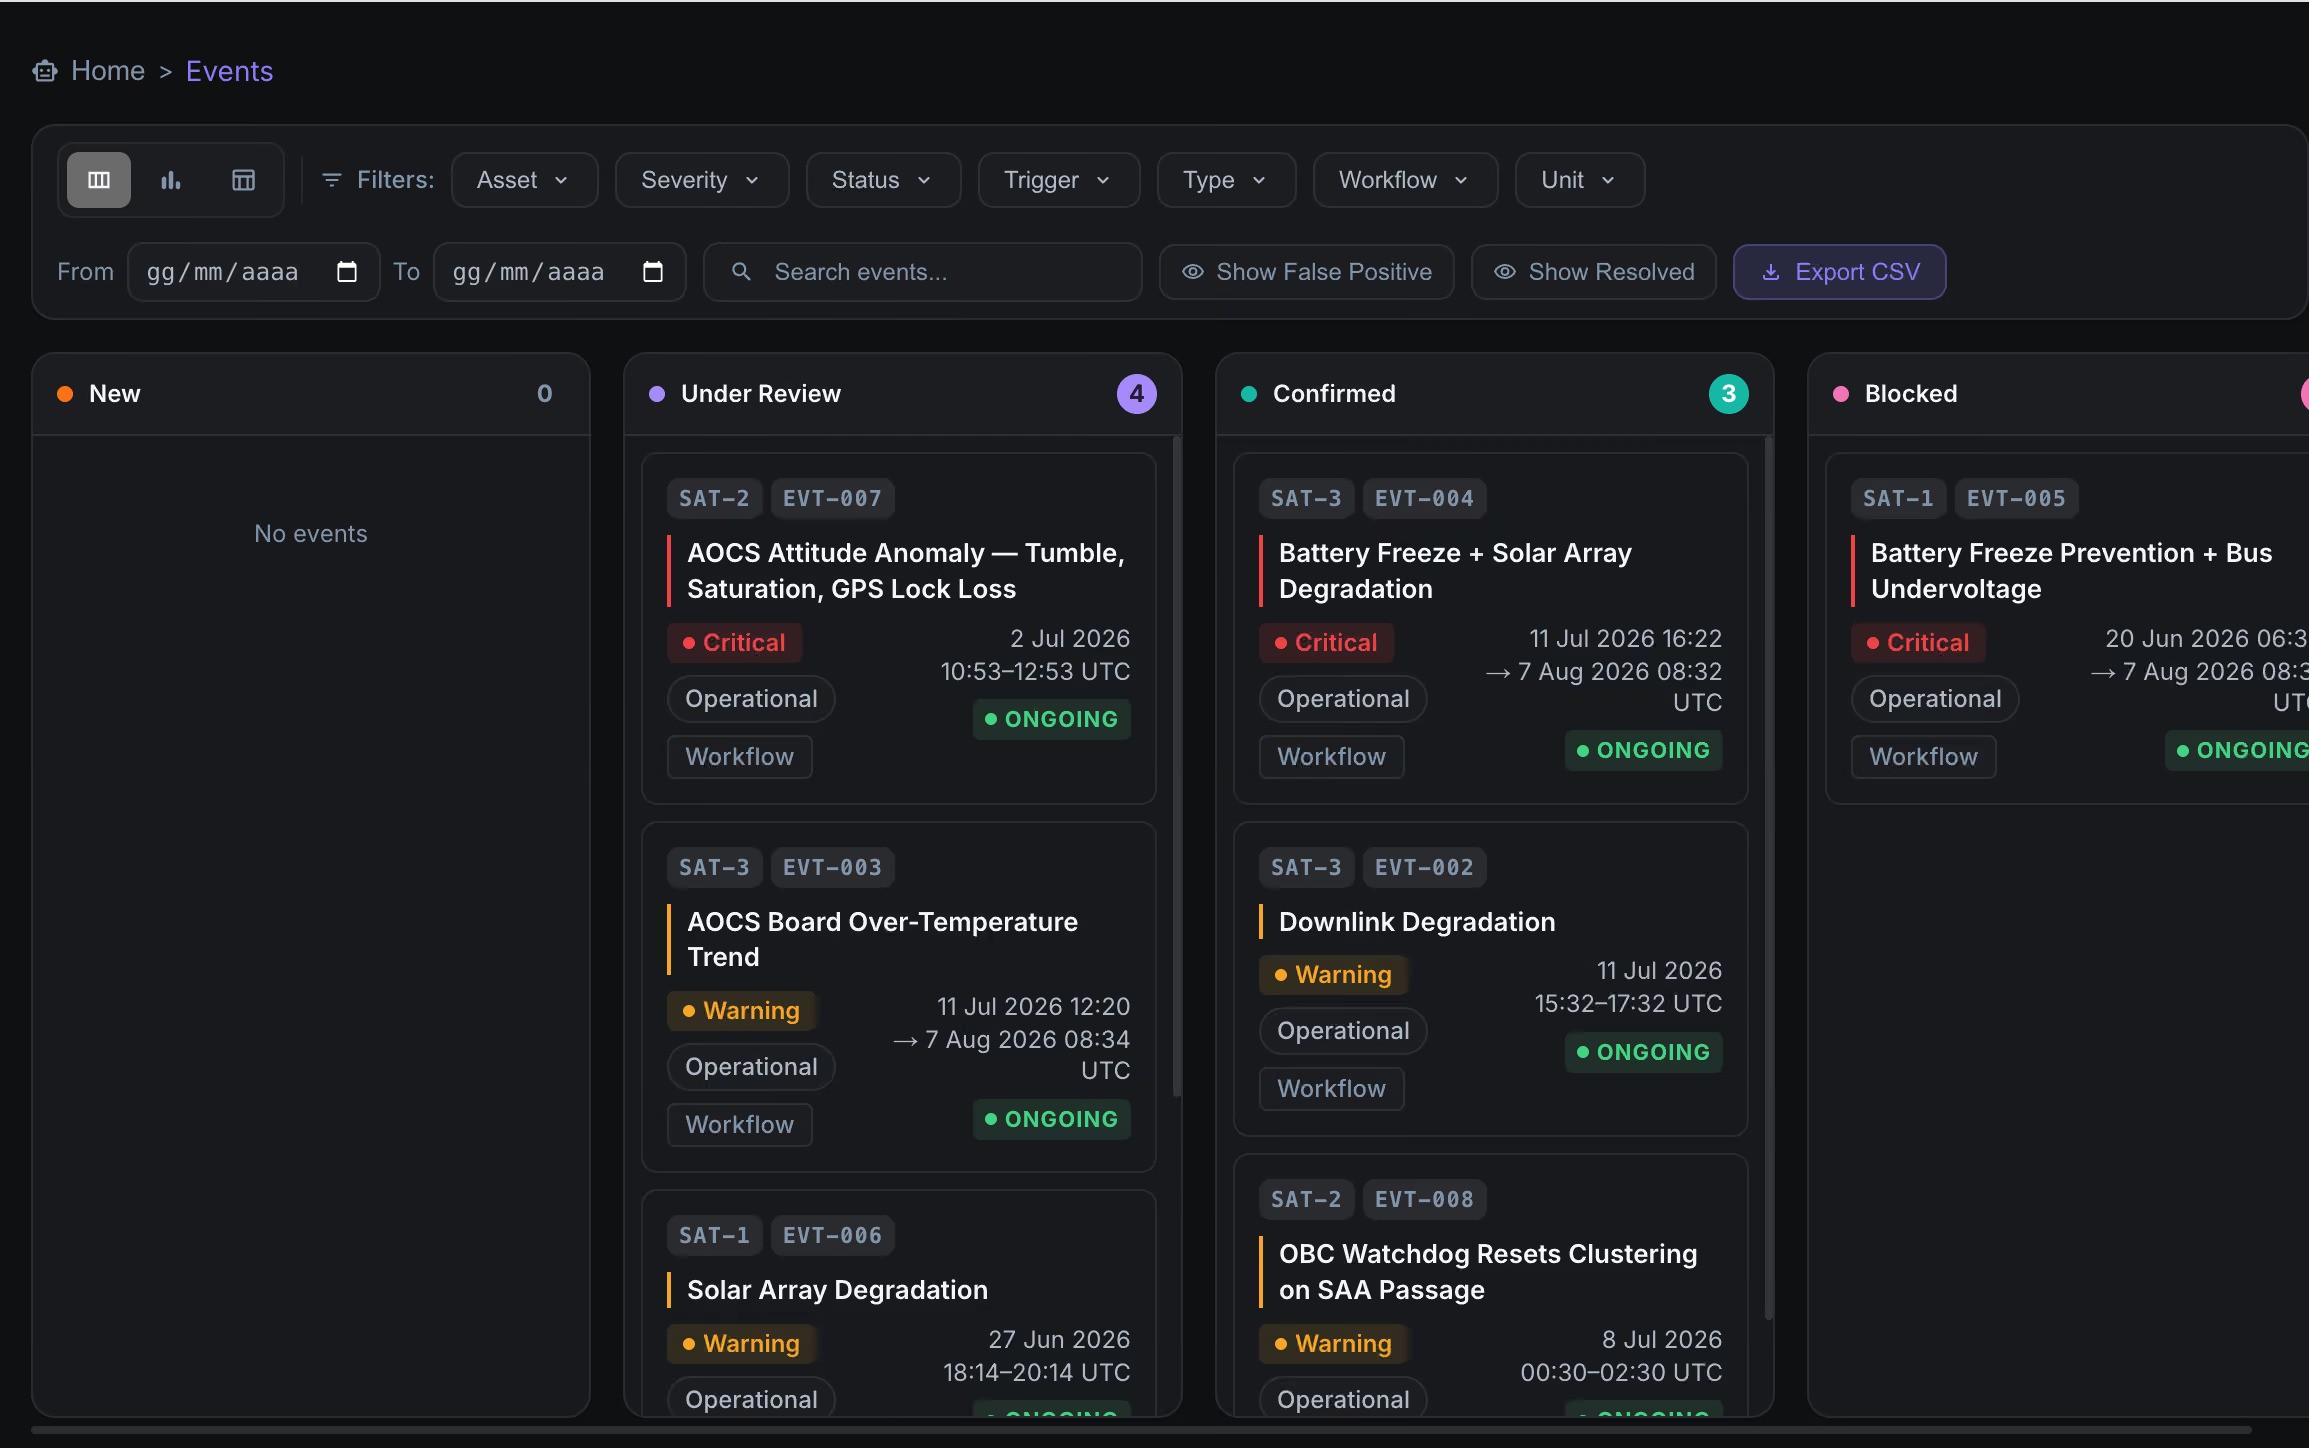
I designed a Kanban-based view that allows operators to track anomalies as they move through different investigation states. Recording the reasons behind status changes helps preserve the context of decisions and makes the progression of an investigation easier to follow.
The board transforms anomaly management from a series of isolated analyses into a more structured and traceable operational process.
Design focus
Track the investigation lifecycle through configurable states.
Record the rationale behind status changes.
Preserve context and continuity when work passes between shifts.
The work shifted the focus from making individual telemetry signals easier to spot to helping operators manage the broader investigation process.
Instead of starting from charts and manually reconstructing the relationships between signals, operators can begin with highlighted events, explore suggested correlations and track investigations through a dedicated workflow.
The Kanban board also supports continuity across shifts by preserving investigation states and the reasoning behind changes.